Thomas M. Brooks, H. Resit Akçakaya, Neil D. Burgess, Stuart H.M. Butchart, Craig Hilton-Taylor, Michael Hoffmann, Diego Juffe-Bignoli, Naomi Kingston, Brian MacSharry, Mike Parr, Laurence Perianin, Eugenie C. Regan, Ana S.L. Rodrigues, Carlo Rondinini, Yara Shennan-Farpon & Bruce E. Young.
Two processes for regional environmental assessment are currently underway: the Global Environment Outlook (GEO) and Intergovernmental Platform on Biodiversity and Ecosystem Services (IPBES). Both face constraints of data, time, capacity, and resources. To support these assessments, we disaggregate three global knowledge products according to their regions and subregions. These products are: The IUCN Red List of Threatened Species, Key Biodiversity Areas (specifically Important Bird & Biodiversity Areas [IBAs], and Alliance for Zero Extinction [AZE] sites), and Protected Planet. We present fourteen Data citations: numbers of species occurring and percentages threatened; numbers of endemics and percentages threatened; downscaled Red List Indices for mammals, birds, and amphibians; numbers, mean sizes, and percentage coverages of IBAs and AZE sites; percentage coverage of land and sea by protected areas; and trends in percentages of IBAs and AZE sites wholly covered by protected areas. These data will inform the regional/subregional assessment chapters on the status of biodiversity, drivers of its decline, and institutional responses, and greatly facilitate comparability and consistency between the different regional/subregional assessments.
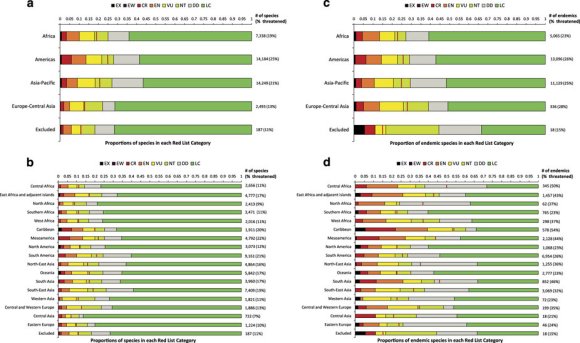
Proportion of species, by Red List Category, in comprehensively assessed groups on The IUCN Red List of Threatened Species (Version 2015-2) occurring in each IPBES region (a) and subregion (b); and proportion of endemic species, by Red List Category, in comprehensively assessed groups on The IUCN Red List of Threatened Species (Version 2015-2) occurring in each IPBES region (c) and subregion (d). The vertical red lines show the best estimate for the proportion of extant species considered threatened (CR, EN and VU) if Data Deficient species are Threatened in the same proportion as data-sufficient species. The numbers to the right of each bar represent the total number of species assessed and in parentheses the best estimate of the percentage threatened. CR, critically endangered; DD, data deficient; EN, endangered; EW, extinct in the wild; EX, extinct; LC, least concern; NT, near threatened; VU, vulnerable.

You must be logged in to post a comment.