Stuart H.M. Butchart, Martin Clarke, Robert J. Smith, Rachel E. Sykes, Jorn P.W. Scharlemann, Mike Harfoot, Graeme M. Buchanan, Ariadne Angulo, Andrew Balmford, Bastian Bertzky, Thomas M. Brooks, Kent E. Carpenter, Mia T. Comeros-Raynal, John Cornell, G. Francesco Ficetola, Lincoln D.C. Fishpool, Richard A. Fuller1, Jonas Geldmann, Heather Harwell, Craig Hilton-Taylor, Michael Hoffmann, Ackbar Joolia, Lucas Joppa, Naomi Kingston, Ian May, Amy Milam, Beth Polidoro, Gina Ralph, Nadia Richman, Carlo Rondinini, Daniel B. Segan, Benjamin Skolnik, Mark D. Spalding, Simon N. Stuart, Andy Symes, Joseph Taylor, Piero Visconti, James E.M. Watson, Louisa Wood, & Neil D. Burgess.
Governments have committed to conserving ≥17% of terrestrial and ≥10% of marine environments globally, especially “areas of particular importance for biodiversity” through “ecologically representative” Protected Area (PA) systems or other “area-based conservation measures,” while individual countries have committed to conserve 3–50% of their land area. We estimate that PAs currently cover 14.6% of terrestrial and 2.8% of marine extent, but 59–68% of ecoregions, 77–78% of important sites for biodiversity, and 57% of 25,380 species have inadequate coverage. The existing 19.7 million km2 terrestrial PA network needs only 3.3 million km2 to be added to achieve 17% terrestrial coverage. However, it would require nearly doubling to achieve, cost-efficiently, coverage targets for all countries, ecoregions, important sites, and species. Poorer countries have the largest relative shortfalls. Such extensive and rapid expansion of formal PAs is unlikely to be achievable. Greater focus is therefore needed on alternative approaches, including community- and privately managed sites and other effective area-based conservation measures.
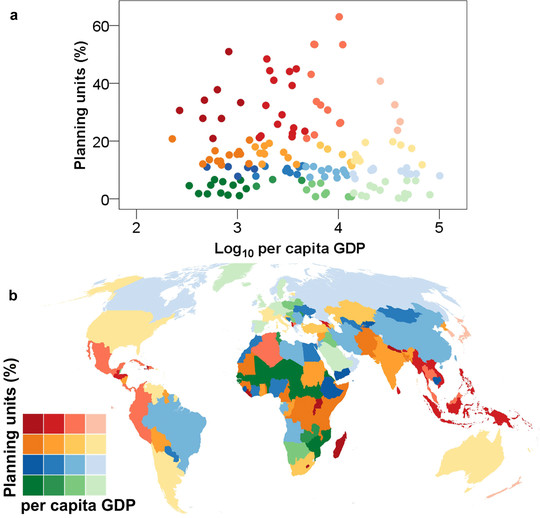 Proportion of planning units requiring conservation areas to be established within them for each country (a) plotted against log gross domestic product (GDP) per capita; and (b) mapped. Colors in the graph match those in the map legend.

You must be logged in to post a comment.